About ADCQR Dashboard
The Australian Diabetes Clinical Quality Registry (ADCQR), is a national registry that collects information on the care provided and outcomes for adults diagnosed with diabetes in Australia. The ADCQR was established in 2023 as the first national Clinical Quality Registry (CQR) for adults with diabetes with its aims to promote and facilitate quality improvement in diabetes care.We are excited to provide the Australian Diabetes Clinical Quality Registry (ADCQR) Site Report for your diabetes centre. In this report, comparisons are made with data for all other similar sites. For example, if your site is a primary or secondary care site, your data is compared to pooled data from other primary and secondary care sites, and similarly if your site is a tertiary care site or centre of excellence, your data is compared to pooled data from other tertiary care and centre of excellence sites. In addition, this report includes comparisons with data for your site collected in previous years (if available). Data specific to your site are identified for your interpretation and use only. No one else has access to the specific data for your site.
The ADCQR is undertaken to promote and facilitate quality improvement in diabetes care. This report provides an overall visual summary of clinical and patient reported outcomes at your site, with further detail for each major outcome. We provide information in simple tabular and graphic formats, with the use of infographics where appropriate. The design of the ADCQR site report is based on formative work undertaken. Statistics for your site include the number of patients (n), percent of patients (overall and by diabetes type) and mean or median where appropriate. Each outcome variable also has a representation of the amount of missing data for that variable. To help aid in dissemination, we provide a PowerPoint template (here) that may be used to present your report to your team. Please add data from this report to the template for your site.
We also provide a guide to using the ADCQR data for Quality Improvement (QI) projects. We encourage you to reflect on your ADCQR data results in accordance with the QI guide to identify areas where QI projects may be able to influence change in process or clinical outcomes at your site.
If you have any questions about your report or how to use your report, please feel free to contact us. The ADCQR would not be possible without the strong commitment of all participating sites to data-driven health care improvement and excellence in diabetes care.
We thank all the multidisciplinary teams who have participated and gratefully acknowledge the support of the National Association of Diabetes Centres (NADC) and the Australian Diabetes Society (ADS) in facilitating the ADCQR and encouraging diabetes health professionals to use this report to inform improvements to care.
Professor Sophia Zoungas
Project Lead on behalf of the ADCQR Project Executive
E: adcqr@monash.edu
Background
Diabetes represents one of the biggest challenges facing healthcare systems. In Australia, 1 in 20 (1.5 million) people are living with diabetes, with 300 Australians developing diabetes every day.1 While there have been improvements in the treatment and management of diabetes, the chronic nature of the condition and complex interplay between risk factors, means that people with diabetes are more likely to develop multisystem complications and comorbidities such as cardiovascular and kidney diseases, and eye and foot complications. As a result, the economic burden of diabetes is large, with an estimated $3.4 billion of health care spending in 2020-21 attributed to diabetes in Australia (representing 2.2% of total disease expenditure)1. The largest contributors to this spending were medications dispensed as part of the Pharmaceutical Benefits Scheme and hospitalisations/hospital services. The Australian Government recognises the burden of diabetes, developing the Australian National Diabetes Strategy to outline Australia’s national response to diabetes and inform how health care and other resources can be better coordinated and targeted across all levels of government.2 The main components of the Australian National Diabetes Strategy are summarised below:Components of the Australian National Diabetes Strategy, 2021-2030
Vision
Strengthen, integrate and coordinate all sectors to improve health outcomes and reduce the social and economic impact of diabetes in Australia
Principles
- Facilitation of person-centred care and self-management throughout life
- Reduction of health inequities
- Collaboration and cooperation to improve health outcomes
- Coordination and integration of diabetes care across services, settings, technology and sectors
- Measurement of health behaviours and outcomes
Goals
- Prevent people developing type 2 diabetes
- Promote awareness and earlier detection of type 1 and type 2 diabetes
- Reduce the burden of diabetes and its complications and improve quality of life
- Reduce the impact of pre-existing diabetes and gestational diabetes in pregnancy
- Reduce the impact of diabetes among Aboriginal and Torres Strait Islander peoples
- Reduce the impact of diabetes among other priority groups
- Strengthen prevention and care through research, evidence and data
The ADCQR is a key contributor towards the goals of the Australian National Diabetes Strategy, and conforms to the ACSQHC Framework for Australian CQRs3 and Australian Government Department of Health National Clinical Quality Registry and Virtual Registry Strategy 2022-2030.5
The ADCQR is the successor to the national audit and feedback activity, Australian National Diabetes Audit (ANDA), and therefore has benefited and leveraged from the formative work undertaken as part of ANDA.6 The Registry (as part of its deliverables) produces annual site-specific reports, as well as an annual report on the current state of the nation, to identify variations in care and inform quality improvement initiatives.
Vision and Aims
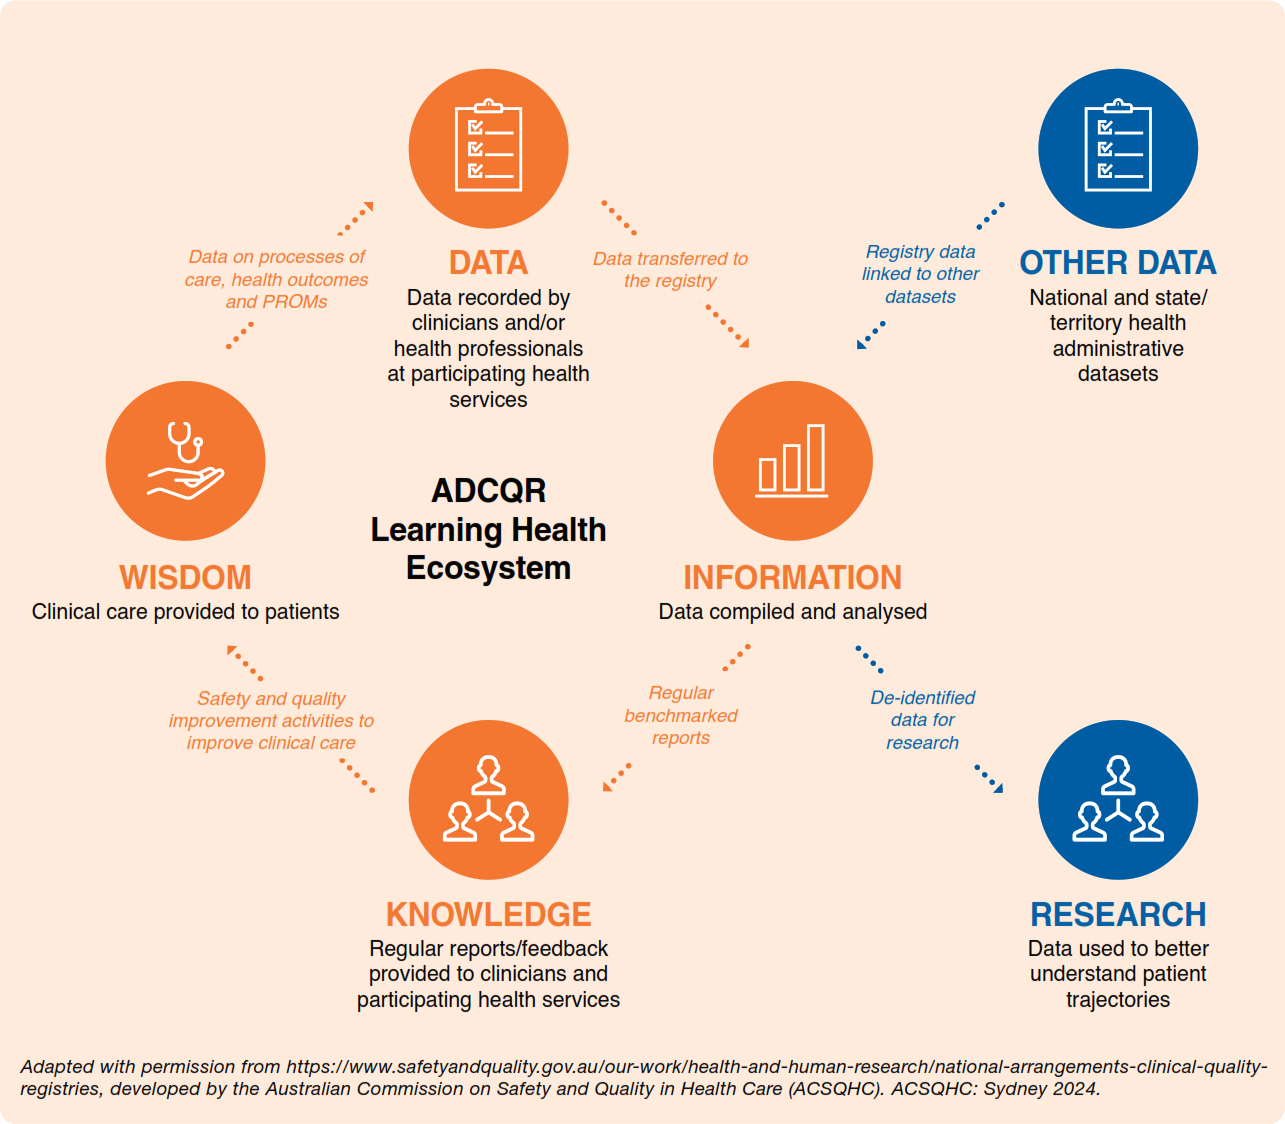
The ADCQR endeavors to become a learning health ecosystem in diabetes care with the vision of participating health services continuously learning from the data collected. Its importance lies in the improvements in the quality and safety of care, and the promotion of the ADCQR for research use to better understand the trajectory of diabetes.The aim of the ADCQR is to develop a longitudinal, multi-centre diabetes CQR to optimise quality of care provided to people diagnosed with diabetes. This will be achieved by:
- Assessing patterns of care and access to care
- Identifying variability in treatments/outcomes amongst people with diabetes
- Benchmarking of process and outcome measures amongst providers of care
- Determining the degree of compliance (and reasons for non-compliance) with best practice-based guidelines for the treatment of diabetes
- Identifying factors that predict favourable and unfavourable treatment outcomes
In addition, this diabetes CQR will improve knowledge and advance treatment by:
- Monitoring trends in outcomes and survival over time
- Providing an infrastructure on which intervention or other studies can be established
- Determining the clinical effectiveness of treatments in a ‘real world’ setting
- Providing information to assist in the credentialing of clinicians and identification of appropriate training resources
ADCQR feedback loop and learning health ecosystem
References
- Australian Institute of Health and Welfare. Diabetes: Australian Facts, 2023 https://www.aihw.gov.au/reports/diabetes/diabetes/contents/summary (accessed 14 December 2023).
- Australian Government Department of Health and Aged Care. Australian National Diabetes Strategy 2021-2030. Canberra: Australian Government Department of Health and Aged Care
- Australian Commission on Safety and Quality in Health Care. National Arrangements for Clinical Quality Registries. https://www.safetyandquality.gov.au/our-work/health-and-human-research/national-arrangements-clinical-quality-registries#australia-s-framework-for-clinical-quality-registries (accessed 14 December 2023).
- Australian Commission on Safety and Quality in Health Care. Prioritised List of Clinical Domains for Clinical Quality Registry Development. Final Report. November 2016. Sydney: Australian Commission on Safety and Quality in Health Care.
- Australian Government Department of Health and Aged Care. Maximising the Value of Australia's Clinical Quality Registries and Virtual Registries 2020-2030.
- Australian National Diabetes Audit. https://www.monash.edu/medicine/anda/home
Instructions for Use: Interpreting your results
Summary and suggested actions
We hope that you find this report useful and that it serves a starting point, to summarise the data from your site.Your ADCQR site report is intended as a summary and may be helpful in actioning the results for your centre. We suggest the following actions:
QI guide,
Source: adapted from Backhouse and Ogunlayi, Quality improvement into practice, BMJ, 2020
Using ADCQR with QI

Source: adapted from Backhouse and Ogunlayi, Quality improvement into practice, BMJ, 2020
QI program steps
Step 1: What is your overall goal for your centre?You will need a clear goal to aim for
Step 2: Assess your ADCQR data
Key considerations:
Step 3: Deciding on a QI project
Decide your criteria for QI projects. These could be projects designed to make improvements that:
Step 4: Plan your project
Your project will need a clear plan, so that you can work out who needs to do what to facilitate improvement. This may involve a series of small steps to work towards a larger goal.
Common problems with QI development and/or implementation
Having an unachievable goal.For example, you might want all patients with suboptimal BMI to lose weight, but this outcome is difficult to achieve. It is likely to need multiple iterations of QI programs targeting nutritional advice, exercise programs and psychological support, as well as highly motivated consumers. A smaller goal, such as increasing consumer knowledge about nutrition may be a more appropriate starting point.
Not being clear about the path to change
You must be conceptually clear about what needs to change and who needs to do what to enable this change. You must be clear about how you will measure change and what you consider improvement.
Not having a local change champion
In busy environments, it can be difficult to leverage change without local change champions. Whatever your goal is, there will be some degree of behavioural change involved for staff. Your project is more likely to succeed if there is someone willing to be a local champion who can guide the process.
Not reviewing your results and plan
Research shows that some healthcare initiatives using the Plan-Do-Study-Act cycle aren't effective and that many don't complete all sections of the cycle. Key components missed include having a clear plan to start with, reviewing the results achieved and how they compare to predicted results, summarising the learning for clinical staff, and using the results to plan changes to implement in the next iteration of the project. QI is not a one-off project, it's a method to make continual improvements and needs to be reviewed and adapted to become more successful.
QI resources
NADC QI resourcesIncluded in your full appendix report
Agency for Healthcare Research and Quality (AHRQ)
Plan-Do-Study-Act (PDSA) directions and examples
https://www.ahrq.gov/health-literacy/improve/precautions/tool2b.html
BMJ Open Quality Quality Improvement Project Guide (Word document download)
https://bmjopenquality.bmj.com/pages/wp-content/uploads/sites/13/2017/07/Qualityimprovementprojectguide.docx
References
- Backhouse, A., & Ogunlayi, F. (2020). Quality improvement into practice. BMJ, 368.
- Cheung, NW, JJ Conn, MC d’Emden, JE Gunton, AJ Jenkins, GP Ross, AK Sinha, S Andrikopoulos, S Codplyr::lagiuri, and SM Twigg (2009). Position statement of the Australian Diabetes Society: individualisation of glycated haemoglobin targets for adults with diabetes mellitus. Medical Journal of Australia 191(6), 339–344.
- Deed, G, E Ackermann, I Arthur, J Barlow, S Jagadeesan, D Kawol, G Kilov, S Leow, JA Manski-Nankervis, R Rasalam, et al. (2016). General Practice Management of Type 2 Diabetes: 2016–18.
- Lalor, E, A Boyden, D Cadilhac, S Codplyr::lagiur, J Doust, D Fraser, M Harris, N Huang, D Johnson, G Johnson, et al. (2012). Guidelines for the management of absolute cardiovascular disease risk.
- Living Evidence for Diabetes Consortium. (2020). Living Evidence Guidelines in Diabetes. available from: https://diabetessociety.com.au/living-guidelines.asphttps://app.magicapp.org/#/guideline/E5AbPE
- Royal Australian College of General Practitioners. (2019). Supporting smoking cessation: A guide for health professionals (Second Edition). Available from: https://www.racgp.org.au/clinical-resources/clinical-guidelines/key-racgp-guidelines/view-all-racgp-guidelines/supporting-smoking-cessation
Registry Methodology
Ethics approval
The ADCQR was established to improve the quality of care and outcomes for people living with diabetes and is considered to be in the public’s interest.To function as a CQR, the ADCQR collects, stores, and uses identifiable, personal and sensitive health information about people with diabetes.
The opt-out approach to participation is used to recruit participants due to the scale and significance of the Registry. In accordance with the State and Federal privacy legislation of Australia, the Australian National Statement for Ethical Conduct in Research,7 the ADCQR has ethics approval under the National Mutual Acceptance (NMA) scheme from the Monash Health Human Research Ethics Committee. Additional ethics approvals are sought from participating sites that do not operate under the NMA.
As part of local research governance processes, it is a requirement for all sites registered to obtain ethics approval and local research governance authorisation prior to commencing data collection.
Governance
The Registry custodian is the School of Public Health and Preventive Medicine (SPHPM), Monash University, and the ADCQR is operated by the Project Executive at SPHPM, under the leadership of Professor Zoungas.The ADCQR Scientific Advisory Committee provides strategic guidance to the Project Executive to ensure the objectives, outcomes and deliverables of the ADCQR, as specified by the Australian Government Department of Health and Aged Care are achieved (Figure 2). This committee consists of representatives of key stakeholder organisations including endocrinologists, general practitioners, consumer representatives, Aboriginal and Torres Strait Islander representatives, and representatives from national peak bodies, and is working to the agreed Terms of Reference with the ultimate vision of assisting the ADCQR to maintain high visibility, appropriate engagement and relevance for diabetes service delivery. The ADCQR Project Executive and Scientific Advisory Committee members are listed at the end of this report.
Governance Structure

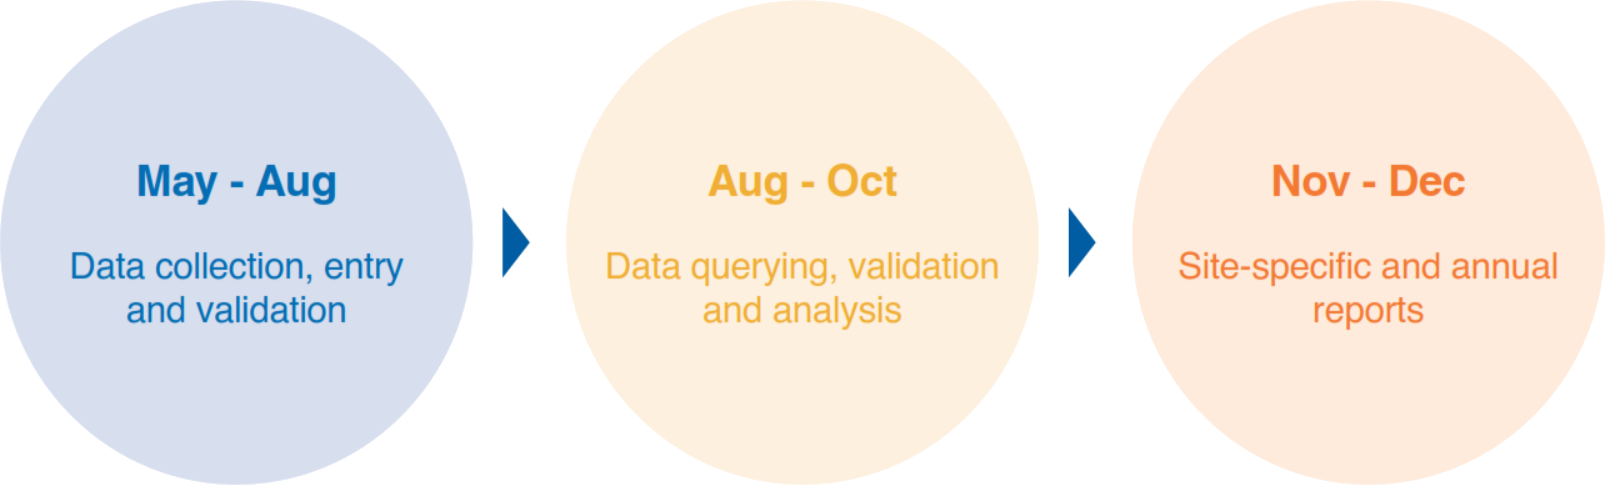
Key Registry Milestones
Expressions of interest and local research and governance processes are ongoing. To reduce the burden on participating health services, the ADCQR collects data during the months of May to June (n.b. participating health services self-select a continuous four-week period during this sampling period to collect data on consecutive patients with diabetes who attend the service and meet the inclusion criteria). The data collection period may be extended until the censorship date of 31 August of each year, at which time the Registry freezes the data for data cleaning, analysis and reporting.ADCQR Key Milestones
Recruitment
Site recruitment
Sites are recruited through the National Association of Diabetes Centres (NADC), a
sub-division of the Australian Diabetes Society (ADS). The NADC, established in 1994,
is a national collective of centres that are involved either directly or indirectly in
diabetes services and care, brought together by a common desire to see improvement in the
standard of diabetes care in Australia.8 The NADC takes a leadership role in developing,
fostering and supporting networks between diabetes services (from primary care to tertiary
(hospital) care settings), recognising that diabetes care requires a shared,
multidisciplinary approach. The NADC facilitates and promotes improved standards of diabetes
care by implementing evidence-based policies and procedures, including developing national
standards and auditing and benchmarking activities.
There are six membership/accreditation levels of the NADC. The ADCQR currently recruits sites
from primary, secondary, tertiary and centre of excellence services:
- Centres of Excellence
Diabetes centres that have demonstrated excellence in education, research, service delivery,
practice/policy development and national influence. These centres must be tertiary-level facilities.
- Tertiary Care Diabetes Services
These centres are hospitals with a full range of clinical diabetes service providers
including endocrinologists, credentialed diabetes educators, dietitians and podiatrists on
staff (full-time) and have demonstrated a high standard of care through service delivery and
organisational capacity.
- Secondary Care Diabetes Services
These centres are typically community services with a range of full and/or part-time
diabetes staff but often do not have an endocrinologist as part of their usual team.
- Primary Care Diabetes Services
These centres have part-time staff and work closely with local general practitioners to
provide care for people with diabetes.
- Pharmacy Diabetes Services
These centres have staff that have received training and/or have expertise in diabetes
and work closely with the local general practitioners (GPs) and allied health staff to provide
additional care and services in the pharmacy context.
- Network Members
The NADC Network membership is offered to Primary Health Networks (PHNs) and State and
Territory Government organisations who work directly with GPs, and other health care providers
to facilitate improved outcomes for patients.
In 2023, there were 204 NADC member diabetes centres across Australia; these operate in a
range of locations and facilities from major metropolitan adult and children’s hospitals to
community-based services including general practices and pharmacies.
Participant recruitment
Participants are recruited through the participating site (health service) based on the following criteria:
Inclusion criteria
Attend a participating centre
Age ≥ 18 years
Patients with T1DM, T2DM or other (secondary) forms of diabetes
Have the capacity to make the decision to opt-out or be included in the Registry
Exclusion criteria
Age < 18 years
Female patients with a diagnosis of gestational diabetes mellitus (not known to have
established diabetes)
As participants are recruited using the opt-out approach, prospective eligible participants
are provided with the Registry participant information sheet by a staff member at their health
service to inform them that their information will be shared with the Registry, and how to opt
out if they change their mind and do not want their information shared. Moreover, their data are
entered into the Registry ‘holding database’ for a two-week period where the data is stored and
not used for any purpose, prior to their consent being assumed and their data included in the Registry.
Data Collection
What information do we collect?
The ADCQR has leveraged from the formative work undertaken as part of ANDA.
In brief, the ANDA dataset used an enhanced version of the National Diabetes Outcomes Quality
Review Initiative (NDOQRIN) dataset, aimed at improving diabetes care through a structured
approach to patient management.9 Initially, this was based on the NDOQRIN minimum dataset
linked to the NSW Clinical Management Guidelines for Diabetes,10 with subsequent updates/enhancements
to the dataset over the years based on feedback from participating health services, as well as the
latest research and evidence in diabetes care and quality improvement.
The ADCQR minimum dataset is based on ANDA 2022. This has considerable concordance with similar
international datasets throughout the United States of America and Europe.11-14 Compared to international
registries, the ADCQR provides comprehensive reporting on multidisciplinary care, diabetes complications
and psychological factors, but lacks benchmarking of structural measures, smoking counselling,
conception/pregnancy counselling and contraceptive counselling.12 Overall, the high rates of agreement
with international practice, supports the validity of the ADCQR in the benchmarking of key quality
indicators regarding diabetes care within Australia.
The ADCQR captures clinical indicators as well as patient self-management outcomes. The clinical component
is collected by the clinician or staff member at the participating site and may be collected during the
patients’ clinical consult or via medical records. It includes information on demographics, blood glucose
control and management methods, other risk factors/biomarkers, medication use, as well as complications
and comorbidities. The patient reported component is self-reported by the patient either directly or with
a health professional at their diabetes health service prior to (in the waiting room) or during their
clinical consult. Participating sites decide how best to deliver the patient reported component for their
patient and/or health service. Completion of the questionnaire directly by patients was intended to reduce
the burden of data collection on participating sites. The patient reported component is one-page and
includes information on smoking status, vaccination status, health professional attendances, medication use,
patient self-care practices including nutrition/diet management and physical activity.
The data collection forms captured most fields using yes/no responses or other choice options to reduce the
amount of written data required.
The ADCQR provides participating health services with a data definitions document, including the ADS
Algorithm15 to assist in the collection of data on treatments (Appendix 2). The ADCQR Public Facing Data
Dictionary provides details on the variables collected and is available on the ADCQR website:
https://www.monash.edu/medicine/sphpm/adcqr
How do we collect this information?
Participating sites have the option to choose from three methods of data collection outlined below.
Web-based data collection – Research electronic data capture (REDCap)
The web-based electronic data capture application, REDCap16 has been previously used in ANDA since
2019, providing familiarity to many of the health services participating in the ADCQR in 2023. Study
data were collected and managed using REDCap electronic data capture tools hosted and managed by Helix
(Monash University). REDCap is a secure, web-based application designed to support data capture for
research studies,17,18 providing:
- an intuitive interface for validated data entry
- audit trails for tracking data manipulation and export procedures
- automated export procedures for seamless data downloads to common statistical packages
- procedures for importing data from external sources
Branching logic coding was used to skip irrelevant questions. Data validations were put in place to
help prevent data entry errors and reduce data queries. Staff were granted access to patients from
their sites only.
Paper-based data collection
The Teleform© sotware was utilised for the design of paper data collection forms.
Once completed by sites and sent to the ADCQR coordinating centre, the forms were entered
directly into REDCap. Any printed data collection forms are stored in a locked room at
SPHPM, Monash University.
Data Extraction
No sites collected data via this method in 2023.
How do we store this information?
All Registry data are kept electronically in accordance with Monash University’s
Information Technology Services Security Framework policy. Patient identifiable data are
stored in a highly secure database that is separate to the clinical and patient reported
data, to reduce the risk of data breaches. Patient clinical and patient reported data are
stored within the Registry database. The data are entered into the Registry ‘holding
database’ for a two-week period, prior to consent being assumed and data included in the
Registry. The date of the patient consult (clinic visit) indicates the commencement of the
opt-out window.
The ADCQR has established a Risk Register to continually assess and manage risk,
including any risks associated with data collection and storing. This is a standing item
on the agenda of all Project Executive and Scientific Advisory Committee meetings.
Data Verification And Validation
Near complete data capture is required to ensure the Registry’s reporting is accurate.
Data validations and quality checks were performed for each site at the end of their data
collection period. Reports were generated for each site, querying missing data, potential
duplicate records and invalid or out-of-range values. Sites were encouraged to address
data queries prior to resubmission to the Registry. Where duplicate records were identified
(multiple case record entries for the same patient), only the first entry was retained.
Data assumptions and manipulations were made according to a pre-defined list of criteria
(see the Supplement to this Report). Corrected data items were updated in the database
prior to final analysis.
Statistical Analyses
Descriptive statistics
Results are presented descriptively as percentages for categorical variables, and mean
and standard deviation (SD) for continuous variables. Variables that were not normally
distributed are presented as median and interquartile range (IQR, where IQR is represented
by the first quartile (Q1 or 25th percentile) and third quartile (Q3 or 75th percentile)).
Percentages are calculated from total respondents (and did not include missing data in the
denominator). Percentages may not always add to 100% due to rounding. Where N is reported,
it refers to the number of patients with available data (denominator). The number of people
that answered 'Yes' (numerator or n) can be estimated by multiplying the reported percentages
by the number of patients with available data (denominator).
Complications/comorbidities are reported as ever reported (percentage of patients with a
diagnosis/detection either in the last 12 months or prior to the last 12 months) and reported
in the last 12 months only (percentage of patients with a diagnosis/detection in the last 12 months.
Urinary albumin and urinary protein levels were used to determine albuminuria. Albuminuria was
determined using the Kidney Disease: Improving Global Outcomes (KDIGO) guidelines.19 Where albumin
measurement was missing, and proteinuria measurement was available, patients were categorised into
albuminuria using the relevant thresholds outlined by KDIGO. Albuminuria was defined as:
Diabetes centres that have demonstrated excellence in education, research, service delivery, practice/policy development and national influence. These centres must be tertiary-level facilities.
These centres are hospitals with a full range of clinical diabetes service providers including endocrinologists, credentialed diabetes educators, dietitians and podiatrists on staff (full-time) and have demonstrated a high standard of care through service delivery and organisational capacity.
These centres are typically community services with a range of full and/or part-time diabetes staff but often do not have an endocrinologist as part of their usual team.
These centres have part-time staff and work closely with local general practitioners to provide care for people with diabetes.
These centres have staff that have received training and/or have expertise in diabetes and work closely with the local general practitioners (GPs) and allied health staff to provide additional care and services in the pharmacy context.
The NADC Network membership is offered to Primary Health Networks (PHNs) and State and Territory Government organisations who work directly with GPs, and other health care providers to facilitate improved outcomes for patients.
In brief, the ANDA dataset used an enhanced version of the National Diabetes Outcomes Quality Review Initiative (NDOQRIN) dataset, aimed at improving diabetes care through a structured approach to patient management.9 Initially, this was based on the NDOQRIN minimum dataset linked to the NSW Clinical Management Guidelines for Diabetes,10 with subsequent updates/enhancements to the dataset over the years based on feedback from participating health services, as well as the latest research and evidence in diabetes care and quality improvement.
The ADCQR minimum dataset is based on ANDA 2022. This has considerable concordance with similar international datasets throughout the United States of America and Europe.11-14 Compared to international registries, the ADCQR provides comprehensive reporting on multidisciplinary care, diabetes complications and psychological factors, but lacks benchmarking of structural measures, smoking counselling, conception/pregnancy counselling and contraceptive counselling.12 Overall, the high rates of agreement with international practice, supports the validity of the ADCQR in the benchmarking of key quality indicators regarding diabetes care within Australia.
The ADCQR captures clinical indicators as well as patient self-management outcomes. The clinical component is collected by the clinician or staff member at the participating site and may be collected during the patients’ clinical consult or via medical records. It includes information on demographics, blood glucose control and management methods, other risk factors/biomarkers, medication use, as well as complications and comorbidities. The patient reported component is self-reported by the patient either directly or with a health professional at their diabetes health service prior to (in the waiting room) or during their clinical consult. Participating sites decide how best to deliver the patient reported component for their patient and/or health service. Completion of the questionnaire directly by patients was intended to reduce the burden of data collection on participating sites. The patient reported component is one-page and includes information on smoking status, vaccination status, health professional attendances, medication use, patient self-care practices including nutrition/diet management and physical activity.
The data collection forms captured most fields using yes/no responses or other choice options to reduce the amount of written data required.
The ADCQR provides participating health services with a data definitions document, including the ADS Algorithm15 to assist in the collection of data on treatments (Appendix 2). The ADCQR Public Facing Data Dictionary provides details on the variables collected and is available on the ADCQR website: https://www.monash.edu/medicine/sphpm/adcqr
How do we collect this information?
Participating sites have the option to choose from three methods of data collection outlined below.
Web-based data collection – Research electronic data capture (REDCap)
The web-based electronic data capture application, REDCap16 has been previously used in ANDA since 2019, providing familiarity to many of the health services participating in the ADCQR in 2023. Study data were collected and managed using REDCap electronic data capture tools hosted and managed by Helix (Monash University). REDCap is a secure, web-based application designed to support data capture for research studies,17,18 providing:
- an intuitive interface for validated data entry
- audit trails for tracking data manipulation and export procedures
- automated export procedures for seamless data downloads to common statistical packages
- procedures for importing data from external sources
Paper-based data collection
The Teleform© sotware was utilised for the design of paper data collection forms. Once completed by sites and sent to the ADCQR coordinating centre, the forms were entered directly into REDCap. Any printed data collection forms are stored in a locked room at SPHPM, Monash University.
Data Extraction
No sites collected data via this method in 2023.
How do we store this information?
All Registry data are kept electronically in accordance with Monash University’s Information Technology Services Security Framework policy. Patient identifiable data are stored in a highly secure database that is separate to the clinical and patient reported data, to reduce the risk of data breaches. Patient clinical and patient reported data are stored within the Registry database. The data are entered into the Registry ‘holding database’ for a two-week period, prior to consent being assumed and data included in the Registry. The date of the patient consult (clinic visit) indicates the commencement of the opt-out window.
The ADCQR has established a Risk Register to continually assess and manage risk, including any risks associated with data collection and storing. This is a standing item on the agenda of all Project Executive and Scientific Advisory Committee meetings.
Data Verification And Validation
Near complete data capture is required to ensure the Registry’s reporting is accurate. Data validations and quality checks were performed for each site at the end of their data collection period. Reports were generated for each site, querying missing data, potential duplicate records and invalid or out-of-range values. Sites were encouraged to address data queries prior to resubmission to the Registry. Where duplicate records were identified (multiple case record entries for the same patient), only the first entry was retained. Data assumptions and manipulations were made according to a pre-defined list of criteria (see the Supplement to this Report). Corrected data items were updated in the database prior to final analysis.Statistical Analyses
Descriptive statistics
Results are presented descriptively as percentages for categorical variables, and mean and standard deviation (SD) for continuous variables. Variables that were not normally distributed are presented as median and interquartile range (IQR, where IQR is represented by the first quartile (Q1 or 25th percentile) and third quartile (Q3 or 75th percentile)). Percentages are calculated from total respondents (and did not include missing data in the denominator). Percentages may not always add to 100% due to rounding. Where N is reported, it refers to the number of patients with available data (denominator). The number of people that answered 'Yes' (numerator or n) can be estimated by multiplying the reported percentages by the number of patients with available data (denominator).
Complications/comorbidities are reported as ever reported (percentage of patients with a diagnosis/detection either in the last 12 months or prior to the last 12 months) and reported in the last 12 months only (percentage of patients with a diagnosis/detection in the last 12 months.
Urinary albumin and urinary protein levels were used to determine albuminuria. Albuminuria was determined using the Kidney Disease: Improving Global Outcomes (KDIGO) guidelines.19 Where albumin measurement was missing, and proteinuria measurement was available, patients were categorised into albuminuria using the relevant thresholds outlined by KDIGO. Albuminuria was defined as:
In Australia, the units of measurement that urinary albumin and urinary protein levels are most commonly reported in terms of mg/L (AER and PER) and ratio (ACR and PCR using mg/mmol). To categorise patients into albuminuria using mg/L units of measurement, the following thresholds were employed:
eGFR levels were used to determine chronic kidney disease (CKD). KDIGO guidelines define CKD as any abnormality of kidney structure or function that is present for >3 months, with implications for health.19
- Stage 1: eGFR ≥90 mL/min/1.73m2 and evidence of kidney damage (albuminuria, urine sediment abnormalities, electrolyte and other abnormalities due to tubular disorders, structural abnormalities on histology or imaging and history of kidney transplantation)
- Stage 2: eGFR 60-89 mL/min/1.73m2 and evidence of kidney damage
- Stage 3: eGFR 30-59 mL/min/1.73m2
- Stage 4: eGFR 15-29 mL/min/1.73m2
- Stage 5: eGFR <15 mL/min/1.73m2
Selected analyses are also reported for people with and without cardiovascular disease (CVD), where CVD includes myocardial infarction, CABG/angioplasty, stroke, congestive cardiac failure or peripheral vascular disease.
Subgroup analyses: Centre type
Given the different patient populations attending primary, secondary and tertiary health care settings, results by centre type are presented. For comparability, pooled patient data from CoEs & Tertiary care services were compared to pooled patient data from Secondary & Primary care services.
Additional analyses
The Supplement to this Report provides additional analyses including
Box and Whisker Plots
Box and whisker plots are used to show how data is distributed and any outliers. These have been included to show the distribution of HbA1c levels across patients at your site and compared to other similar sites. Current and historical data (if available) has been included for comparison.
The following is an example of how to interpret box and whisker plots:

Risk Adjusted Funnel Plots
Funnel plots are graphical methods used to detect variation in clinical performance across participating sites by plotting the mean values or rates (proportion) of patients at each participating site for selected key clinical indicators. In this site report, four key clinical indicators are assessed: HbA1c, low-density lipoprotein cholesterol (LDL-C), systolic blood pressure (SBP) and rates of severe hypoglycaemia. Clinical performance was adjusted for statistically significant, non-care related patient factors prior to plotting such as age, sex, and duration of diabetes. This process allows comparability across sites, who may see very different patient populations. The factors that have been adjusted for are included at the bottom of each graph.
The following is an example of how to interpret the funnel plots:

Contact Information
Site reports are produced by the Australian Diabetes Clinical Quality Registry (ADCQR). Thank you to all diabetes centres and individuals who have generously participated in the ADCQR.Suggested citation:
Australian Diabetes Clinical Quality Registry Site Report 2023. Monash University, School of Public Health and Preventive Medicine, December 2023.Any enquiries should be directed to:
                    Australian Diabetes Clinical Quality Registry
                    Monash University
                    553 St Kilda Road
                    Melbourne
                    VIC 3004
Site Feedback Form
Thank you for using the ADCQR dashboard. Your feedback helps us continously improve the dashboard and reporting.For each of the questions below, please select an answer.
Your contribution to ADCQR to date
- Mean HbA1c
- HbA1c distribution at your site
- HbA1c benchmarking
- Clinical variation in glycaemic control
- Clinical variation in rates of hypoglycemia
Guideline recommendations for measurement:
• Measure every 3-6 months for all patients who are newly diagnosed, undergoing therapeutic changes, or outside of recommended ranges• Measure every 6-12 months for all stable patients at agreed targets
• Target is ≤ 7% for most adults
Lower HbA1c targets (6 – 6.5%) may be appropriate where the risk of hypoglycaemia can be minimised.
Individualised HbA1c targets (such as <8%) may be appropriate for adults with a history of severe hypoglycaemia, limited life expectancy, advanced microvascular or macrovascular complications and extensive comorbid conditions.
Where not meeting target, consider medication review and treatment intensification. Treatment intensification will require increased monitoring of blood glucose levels to minimise the risk of hypoglycaemia and active involvement of the person with diabetes. Where appropriate, consider referral to dietician for assessment and education regarding carbohydrate counting and/or dietary advice. Consideration should also be given to managing the effects of exercise on blood sugar levels.
Type 1
Target: ≤ 7%
Type 2
Target: ≤ 7%
Benchmarking against sites in the same category:
• Years that have less than 5 samples are excluded.
Type 1
Type 2
Benchmarking against sites in the same category:
• Years that have less than 5 samples are excluded.
Type 1
Type 2
Benchmarking against sites in the same category:
• Years that have less than 5 samples are excluded.
The Living Evidence for Diabetes Consortium Guidelines (2020):
• Suggest continuous glucose monitoring (CGM) rather than self-monitoring of blood glucose (finger pricking) alone for all adults with type 1 diabetes treated with multiple daily injections.
• Consider discussion of CGM and eligibility for subsidised CGM (NDSS).
Type 1
Type 2
Type 1
The Living Evidence for Diabetes Consortium Guidelines (2020):
Type 2
The Living Evidence for Diabetes Consortium Guidelines (2020):
Type 1
Target: < 25 kg/m2
Type 2
Target: < 25 kg/m2
- Type 1
- Type 2
- Clinical variation in blood pressure control
- Antihypertensives - Type 1
- Antihypertensives - Type 2
Type 1
Targets:
Type 2
Targets:
Type 1
Type 2
Benchmarking against sites in the same category:
• Years that have less than 5 samples are excluded.
Type 1
Target: 0% smoking for all patients
For all people who smoke, offer brief advice:
See references for details of RACGP Guidelines.
Type 2
Target: 0% smoking for all patients
For all people who smoke, offer brief advice:
See references for details of RACGP Guidelines.
- Lipids - Type 1
- Lipids - Type 2
- Clinical variation in lipids control
- Lipid medications - Type 1
- Lipid medications - Type 2
Type 1
Targets:
- Target lipids within the following ranges:
- Total cholesterol: Target < 4.0 mmol/L
- LDL cholesterol: Target < 2.0 mmol/L
- HDL cholesterol: Target ≥ 1.0 mmol/L
- Non-HDL cholesterol: Target < 2.5 mmol/L
- Triglycerides: Target < 2.0 mmol/L
Type 2
Targets:
- Target lipids within the following ranges:
- Total cholesterol: Target < 4.0 mmol/L
- LDL cholesterol: Target < 2.0 mmol/L
- HDL cholesterol: Target ≥ 1.0 mmol/L
- Non-HDL cholesterol: Target < 2.5 mmol/L
- Triglycerides: Target < 2.0 mmol/L
Type 1
Type 2
Benchmarking against sites in the same category:
• Years that have less than 5 samples are excluded.
Complications in the last 12 months
Complications were defined as: cerebral stroke, myocardial infarction, congestive cardiac failure, CABG/Angioplasty, end stage kidney disease, foot ulceration, foot amputation, retinopathy, blindness, sexual dysfunction, diabetic ketoacidosis, hyperosmolar hyperglycaemic state, or severe hypoglycaemia.
Type 1
Foot related complications in the last 12 months
Target:
Overall target is to identify the “high risk foot”, active foot problems and prevent non-traumatic amputations.
Type 2
Foot related complications in the last 12 months
Target:
Overall target is to identify the “high risk foot”, active foot problems and prevent non-traumatic amputations.
Type 1
Diabetes related eye disease in the last 12 months
Target:
Target is to identify individuals who have treatable retinopathy to prevent visual impairment and blindness. All patients should be assessed by an optometrist and/or ophthalmologist with the following frequency:
Where not meeting these targets, consider referral to an optometrist and/or ophthalmologist for assessment
Type 2
Diabetes related eye disease in the last 12 months
Target:
Target is to identify individuals who have treatable retinopathy to prevent visual impairment and blindness. All patients should be assessed by an optometrist and/or ophthalmologist with the following frequency:
Where not meeting these targets, consider referral to an optometrist and/or ophthalmologist for assessment
Type 1
Albuminuria, eGFR, and kidney disease diagnosed or detected in the last 12 months
Target:
Overall target is to identify and treat individuals with nephropathy
Type 2
Albuminuria, eGFR, and kidney disease diagnosed or detected in the last 12 months
Target:
Overall target is to identify and treat individuals with nephropathy
Patient dietary practices
Factors contributing to diet/nutrition management
Physical activity
Target: ≥ 150 mins/week of moderate or vigorous physical activity Intensity of physical activity is defined by The National Physical Activity Guidelines for Australians:
Target: ≥ 150 mins/week of moderate or vigorous physical activity
Intensity of physical activity is defined by The National Physical Activity Guidelines for Australians:
Patient dietary practices
Factors contributing to diet/nutrition management
Physical activity
Target: ≥ 150 mins/week of moderate or vigorous physical activity Intensity of physical activity is defined by The National Physical Activity Guidelines for Australians:
Target: ≥ 150 mins/week of moderate or vigorous physical activity